[Telemetry] 使用 Telegraf 和 InfluxDB,記錄系統資源使用量
本來是想學 Telegraf + InfluxDB + Grafana 三位一體的,
不過發現對這一塊知識太過淺薄,
還是先從 Telegraf + InfluxDB 刀劍合璧就好…
1. 安裝 Telegraf
在 Mac 上的話,可以用 Homebrew 直接安裝 Telegraf:
brew install telegraf
2. 安裝 InfluxDB
到 InfluxDB 的下載頁,可以選擇安裝的方式,
可以選擇 Docker 映象檔、或是各個作業系統上的執行檔。
我初學想避免一些麻煩,因此選擇給 Mac 使用的執行檔。
下載了 influxdb2-2.0.7-darwin-amd64.tar.gz 後,
把它解開放到任一目錄,例如:
tar xvf influxdb2-2.0.7-darwin-amd64.tar.gz
這會解開兩個執行檔:
- influx:這是 InfluxDB 的 client 端
- influxd:這是 InfluxDB 的 daemon service
3. 執行 InfluxDB
執行 ./influxd 後,InfluxDB 就會開始執行,
並且預設會在 http://localhost:8086 開啟一個管理用的 Web Server,
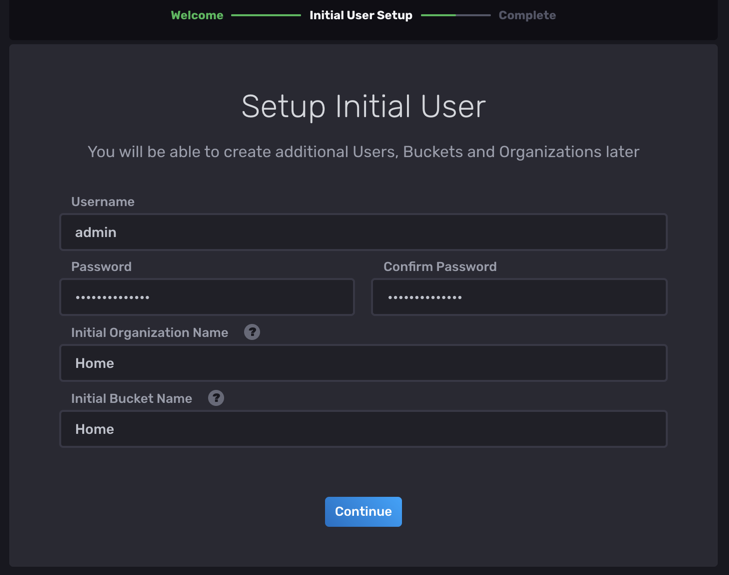
按下 Get Started 開始設定:

首先要建立一個使用者,設定密碼和一些資訊:
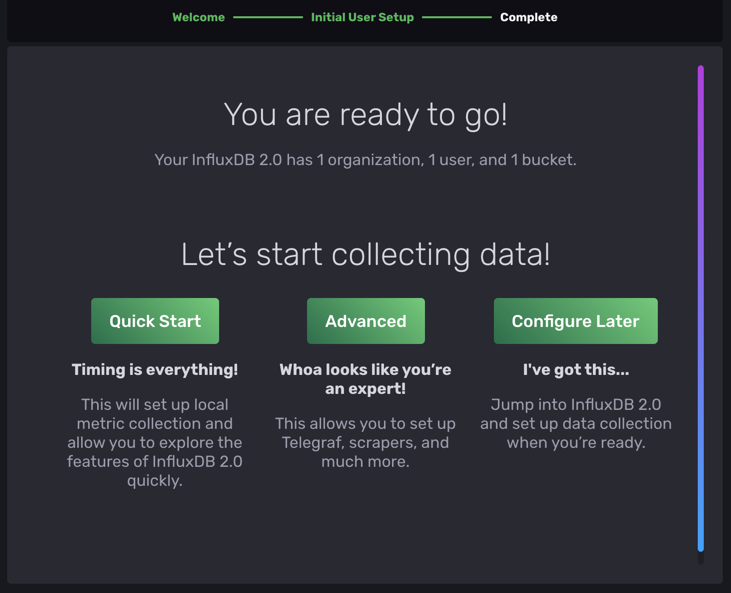
接著可以選擇是否要幫你建立一個本機的資料收集,
這樣就可以快速的開始試用 InfluxDB。
已經很熟悉 InfluxDB 的話,則可以自己選擇設定所有的東西。
我們可以先選 Quick Start 看看:
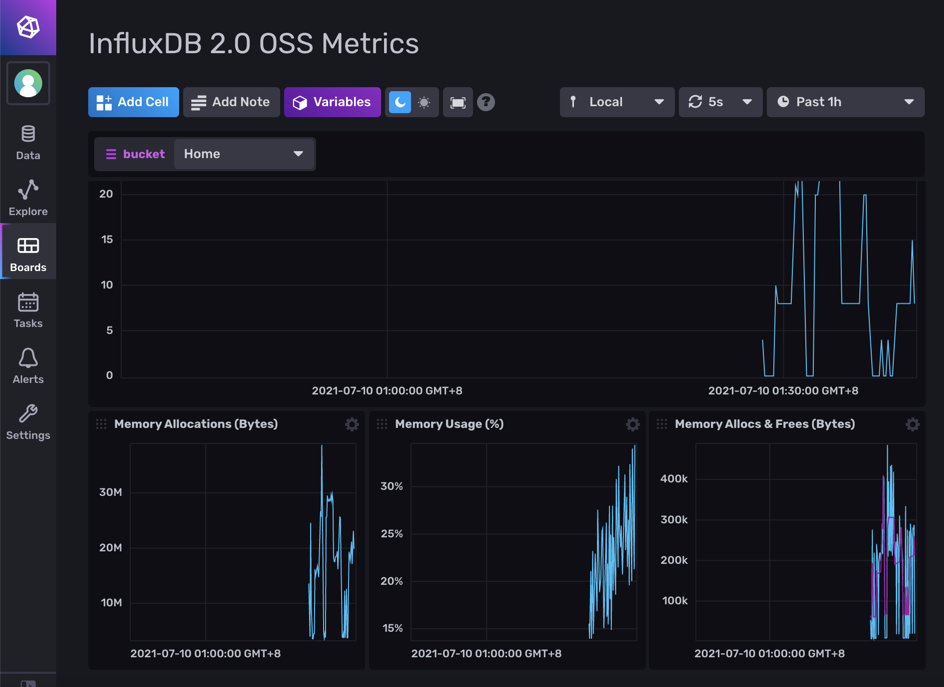
這會產生一個叫 InfluxDB 2.0 OSS Metrics 的儀表板 (dashboard),
裡面有像是 CPU/記憶體等等資訊,應該是 InfluxDB 自己收集來的:
每個儀表格的資料都是要從某些資料來源 (data source) 來的。
點到 Data > Scrapers,可以看到目前儲存到 Home 這個 Bucket 的資料來源,
是 http://localhost:8086/metrics:

而 http://localhost:8086/metrics 這個網址,
基本上就是 InfluxDB 內建收集系統資訊,產生出來的 metrics 資料:
# HELP boltdb_reads_total Total number of boltdb reads
# TYPE boltdb_reads_total counter
boltdb_reads_total 7462
# HELP boltdb_writes_total Total number of boltdb writes
# TYPE boltdb_writes_total counter
boltdb_writes_total 305
# HELP go_gc_duration_seconds A summary of the pause duration of garbage collection cycles.
# TYPE go_gc_duration_seconds summary
go_gc_duration_seconds{quantile="0"} 5.0708e-05
go_gc_duration_seconds{quantile="0.25"} 7.5297e-05
go_gc_duration_seconds{quantile="0.5"} 9.5442e-05
go_gc_duration_seconds{quantile="0.75"} 0.000129964
go_gc_duration_seconds{quantile="1"} 0.004414937
go_gc_duration_seconds_sum 0.025481103
go_gc_duration_seconds_count 127
# HELP go_goroutines Number of goroutines that currently exist.
# TYPE go_goroutines gauge
go_goroutines 1244
......
試玩一下這個儀表板後,可以把它和相關的資料來源刪除,
因為接下來我們想要用 Telegraf 來收集資料~
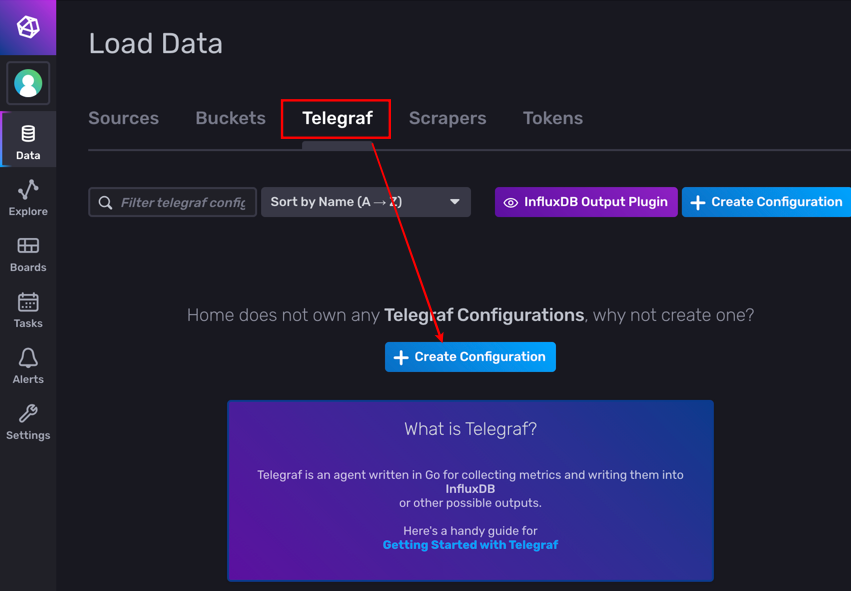
4. 建立 Telegraf 組態,開始送資料
InfluxDB 主控台上提供了連結 Telegraf 的方式。
點選 Data > Telegraf > Create Configuration 準備建立組態:
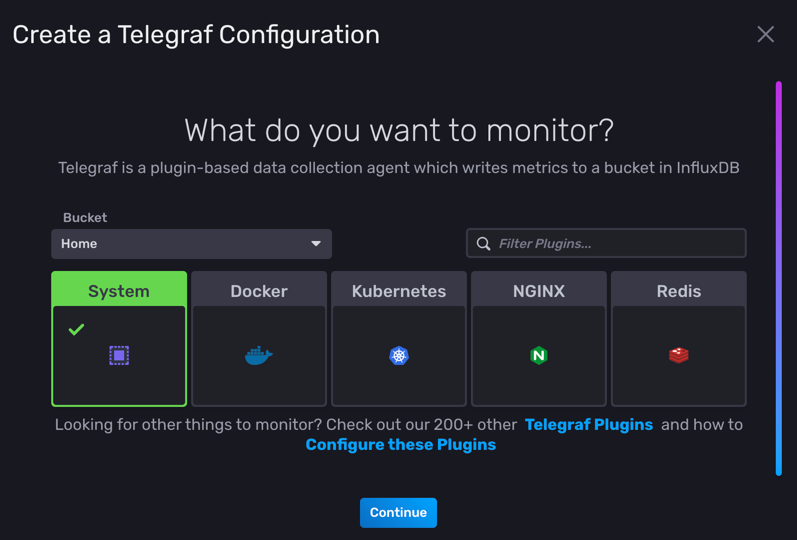
Telegraf 支援非常多的外掛 (plugin),
而下圖是提供一些常見的監控情境,
像是監控系統、Docker 或是 Kubernets 等等。
目前我們就選最基本的 System 系統資源監控:
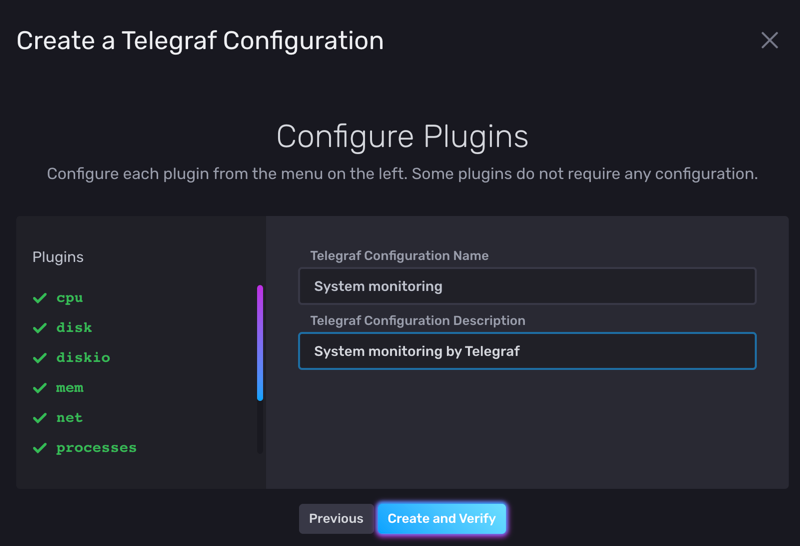
這個情境其實只是幫你預選了相關的 Telegraf 外掛,
像是 System 會把 cpu, disk, diskio, mem, net, processes 等等外掛打開:
最後一步會建立一組 API token,
這是讓 Telegraf 打資料到 InfluxDB 時驗證身分用的,
總不能隨便一個人/程式都能不經驗證的打資料給 InfluxDB 吧~
這個 API token 只會在這裡顯示唯一一次,因此要記得儲存下來:

照著網頁上的指示,將 API token 放到環境變數裡,
再啟動之前已經裝好的 Telegraf,
讓 Telegraf 使用這個新建立好的組態檔來送資料:
export INFLUX_TOKEN=XX7m...
telegraf --config http://localhost:8086/api/v2/telegrafs/07d05322f515b000
這裡的 http://localhost:8086/api/v2/telegrafs/07d05322f515b000 (每個組態檔不同)
是建好儲存在 InfluxDB 裡的 Telegraf 組態檔,
下載下來可以看到它的設定,像我的組態內容如下:
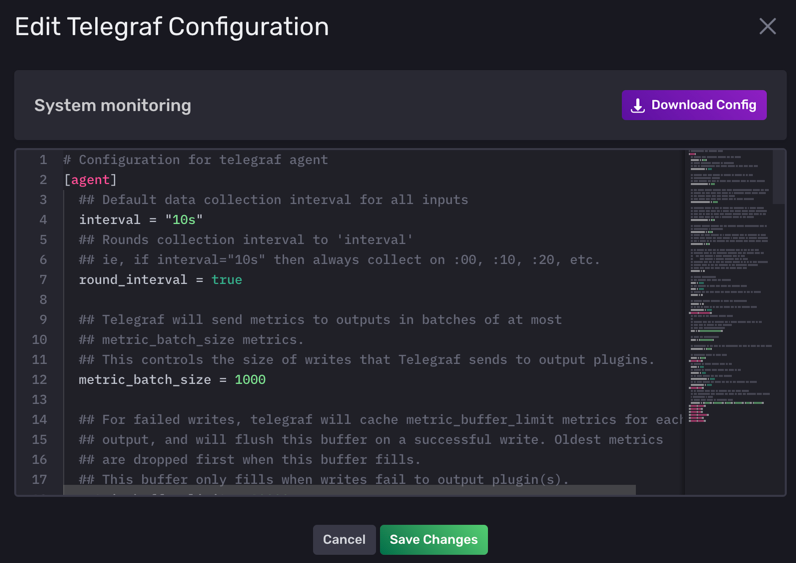
# Configuration for telegraf agent
[agent]
  ## Default data collection interval for all inputs
  interval = "10s"
  ## Rounds collection interval to 'interval'
  ## ie, if interval="10s" then always collect on :00, :10, :20, etc.
  round_interval = true

  ## Telegraf will send metrics to outputs in batches of at most
  ## metric_batch_size metrics.
  ## This controls the size of writes that Telegraf sends to output plugins.
  metric_batch_size = 1000

  ## For failed writes, telegraf will cache metric_buffer_limit metrics for each
  ## output, and will flush this buffer on a successful write. Oldest metrics
  ## are dropped first when this buffer fills.
  ## This buffer only fills when writes fail to output plugin(s).
  metric_buffer_limit = 10000

  ## Collection jitter is used to jitter the collection by a random amount.
  ## Each plugin will sleep for a random time within jitter before collecting.
  ## This can be used to avoid many plugins querying things like sysfs at the
  ## same time, which can have a measurable effect on the system.
  collection_jitter = "0s"

  ## Default flushing interval for all outputs. Maximum flush_interval will be
  ## flush_interval + flush_jitter
  flush_interval = "10s"
  ## Jitter the flush interval by a random amount. This is primarily to avoid
  ## large write spikes for users running a large number of telegraf instances.
  ## ie, a jitter of 5s and interval 10s means flushes will happen every 10-15s
  flush_jitter = "0s"

  ## By default or when set to "0s", precision will be set to the same
  ## timestamp order as the collection interval, with the maximum being 1s.
  ##   ie, when interval = "10s", precision will be "1s"
  ##       when interval = "250ms", precision will be "1ms"
  ## Precision will NOT be used for service inputs. It is up to each individual
  ## service input to set the timestamp at the appropriate precision.
  ## Valid time units are "ns", "us" (or "µs"), "ms", "s".
  precision = ""

  ## Logging configuration:
  ## Run telegraf with debug log messages.
  debug = false
  ## Run telegraf in quiet mode (error log messages only).
  quiet = false
  ## Specify the log file name. The empty string means to log to stderr.
  logfile = ""

  ## Override default hostname, if empty use os.Hostname()
  hostname = ""
  ## If set to true, do no set the "host" tag in the telegraf agent.
  omit_hostname = false
[[outputs.influxdb_v2]]
  ## The URLs of the InfluxDB cluster nodes.
  ##
  ## Multiple URLs can be specified for a single cluster, only ONE of the
  ## urls will be written to each interval.
  ## urls exp: http://127.0.0.1:8086
  urls = ["http://localhost:8086"]

  ## Token for authentication.
  token = "$INFLUX_TOKEN"

  ## Organization is the name of the organization you wish to write to; must exist.
  organization = "Home"

  ## Destination bucket to write into.
  bucket = "Home"
[[inputs.cpu]]
  ## Whether to report per-cpu stats or not
  percpu = true
  ## Whether to report total system cpu stats or not
  totalcpu = true
  ## If true, collect raw CPU time metrics.
  collect_cpu_time = false
  ## If true, compute and report the sum of all non-idle CPU states.
  report_active = false
[[inputs.disk]]
  ## By default stats will be gathered for all mount points.
  ## Set mount_points will restrict the stats to only the specified mount points.
  # mount_points = ["/"]
  ## Ignore mount points by filesystem type.
  ignore_fs = ["tmpfs", "devtmpfs", "devfs", "overlay", "aufs", "squashfs"]
[[inputs.diskio]]
[[inputs.mem]]
[[inputs.net]]
[[inputs.processes]]
[[inputs.swap]]
[[inputs.system]]
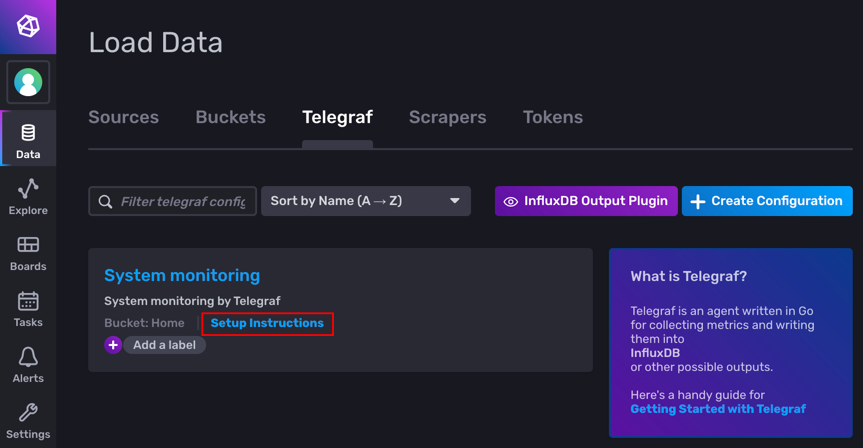
至於啟動 Telegraf 那一長串的指令,如果忘了怎麼辦呢?
回到 Data > Telegraf 那個分頁,
可以看到我們新建立好的 Telegraf 組態檔,
點下 Setup Instructions 就可以看到剛剛啟動 Telegraf 的命令列。
要注意的是,這裡就不會再顯示 INFLUX_TOKEN 的值了:
點下組態檔名稱,也可以檢視/編輯這個組態檔:
5. 檢視 Telegraf 送出來的資料
Telegraf 送進 InfluxDB 的資料會被儲存下來,
而平常檢視就是利用儀表板 (dashboard)。
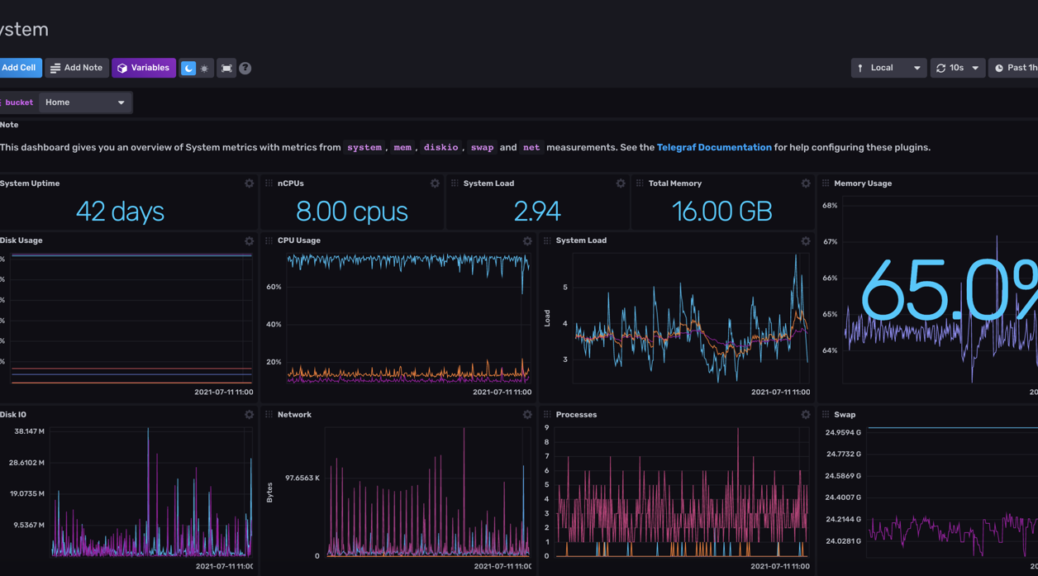
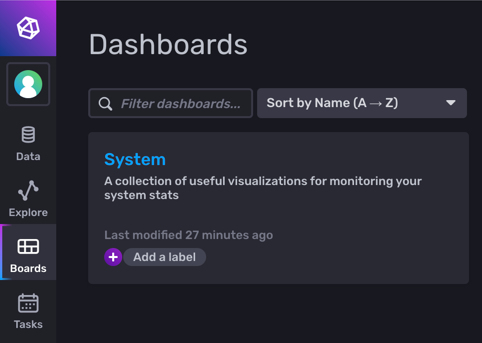
剛剛建立 Telegraf 組態時選擇了 System,看起來它會順便建立一個儀表板,
把相關的資料關聯起來,因此我們可以不用自己建一個:
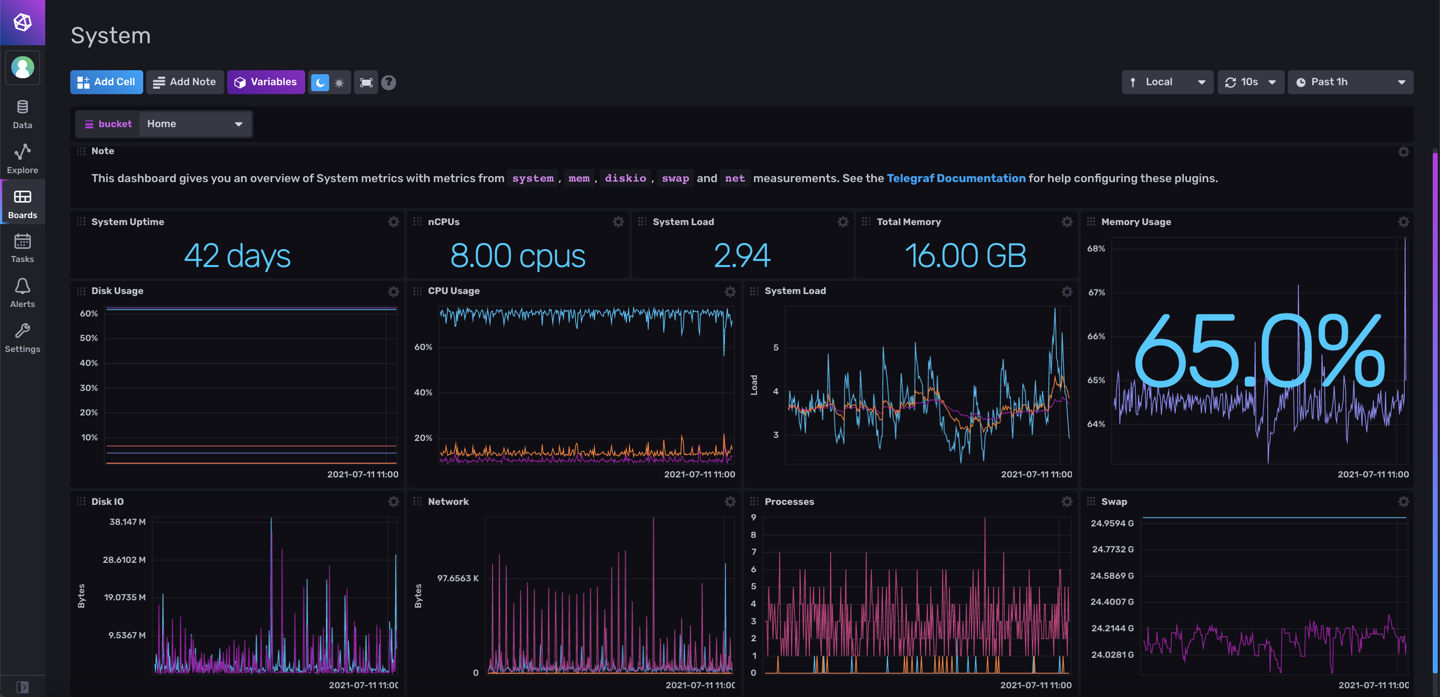
點進這個儀表板後,就可以用視覺化的方式,檢視 Telegraf 送出來的資料。
下面是我將電腦擺了一陣子之後,記錄下來的資料。
像是可以觀察到,我的 CPU 使用率大約不到 20%,
但是記憶體使用率幾乎都在 65% 左右或以上:
以上就是使用 Telegraf 監控系統資源,
並傳送至 InfluxDB 儲存,以視覺化方式檢視的過程。
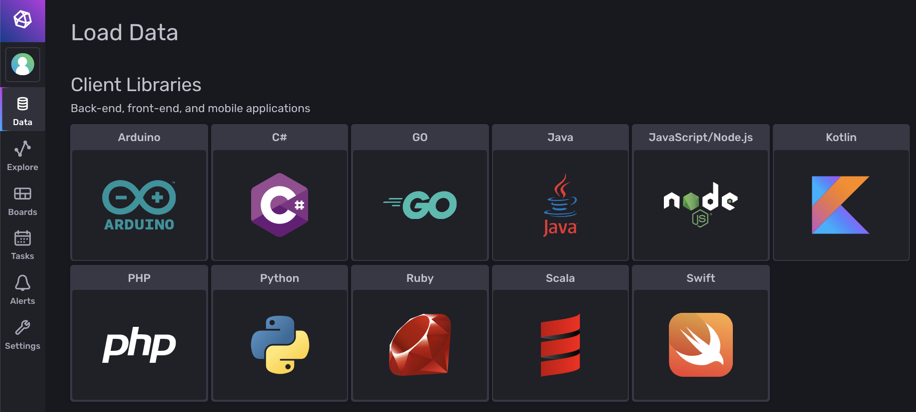
從資料來源那邊,可以看到有非常多的選擇,
甚至也可以自己使用程式語言如 Python, Golang 等等,把資料傳送到 InfluxDB 裡面:
因此有一種應用就是自己寫程式解析資料,再把資料送到 InfluxDB 裡檢視。
下次研究完了,再來寫一篇文章分享囉~:)
One thought on “[Telemetry] 使用 Telegraf 和 InfluxDB,記錄系統資源使用量”
很詳細的入門介紹,感謝